The financial affairs bureau of the Observatoire économique de la Defense (a French defence economic forum) published in its November 2005 edition (Ecodef no. 39) a graphical overview of defence matters; in absolute terms (spending, manpower) and in relative terms (percentage of gross domestic product, spending allocations, the ratio of defence manpower to active civil population); R&D was also covered.
A Graphical Analysis of European Defence
A study of the economic impact of defence, Europe-wide, can be facilitated by cartographic representation of defence costs, both comparative and relative to macroeconomic factors (GDP, working population). The following maps have been designed for the 19 countries of the European Union who are members of NATO, on the basis of 2004 figures from the Organisation’s half-yearly statistical memorandum, and for the six other countries, on information from national sources. They relate to defence budgets, less the pensions element, and security forces with military status are included at the level of 5% for France (Gendarmerie) and 15% for Italy (Carabinieri), in order to embrace only strictly military activity, and to establish comparable parameters between different countries. Figures for defence research and development have been established using OECD statistics for public sector financing of R&D and the defence-related share. Incidentally, financial statistics have been converted to the purchasing power parity of the euro in France. (1)
MIilitary Manpower
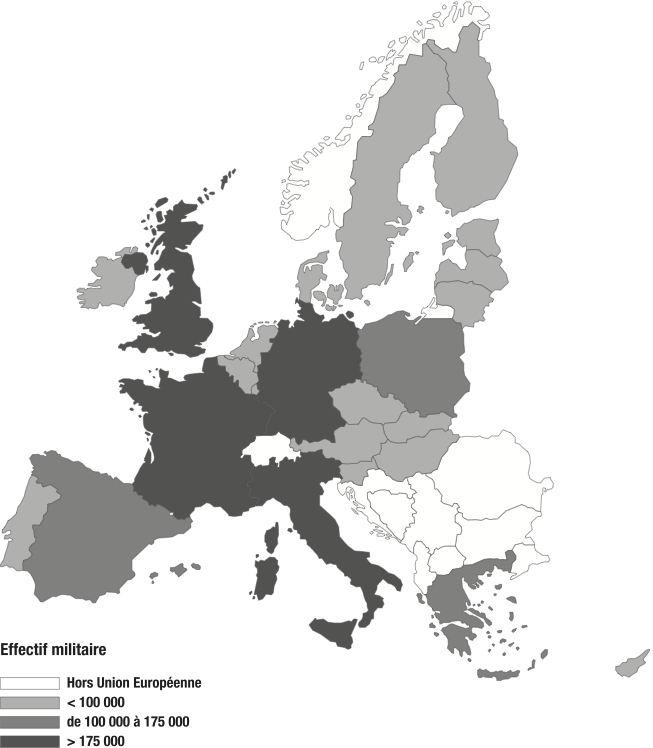
The map of military manpower for each of the 25 countries of the European Union shows the predominance of France, Germany, Italy and the United Kingdom, in that order. Effectively these four countries are the only ones to cross the threshold of 175,000 military personnel, and nearly 55% of the European Union’s armed forces belong to them. (2)
Proportion of Military Manpower to the Working Population
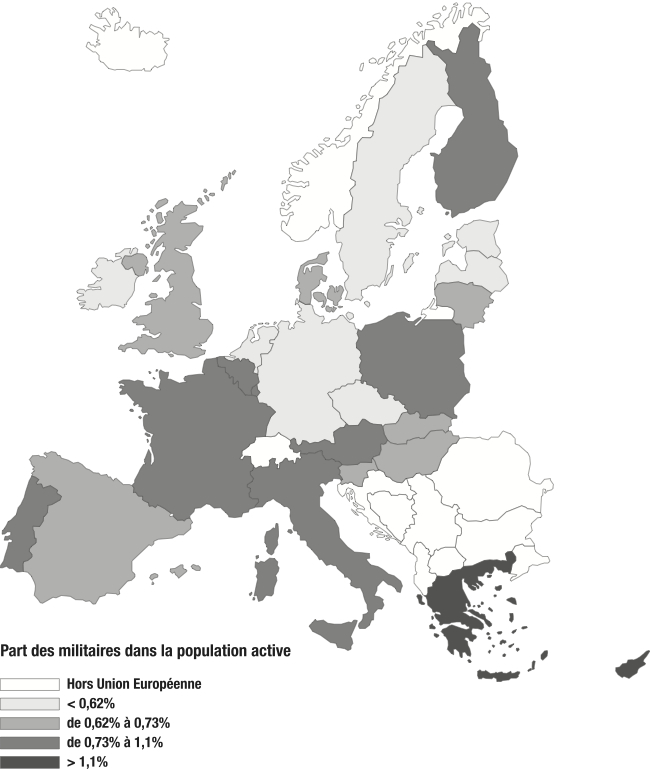
When we compare military manpower to national working population, the picture changes radically from the preceding one. Two significant examples are Germany and the United Kingdom: second and fourth nations in terms of military manpower, they drop to twenty-first and fifteenth position respectively as a proportion of the total working population. Conversely, the three countries where the relative share is highest are Greece (3%) and the two smallest countries of the European Union, Cyprus and Malta, which move to second position (against twentieth previously) and third position (twenty-fourth previously). France and Italy are respectively in sixth and seventh position, with ratios of 0.97% and 0.95%. (3) For countries with a high ratio we can read between the lines the question of labour-market pressures and the necessity to make military employment attractive in order to maintain the required level of recruitment.
Defence Expenditure
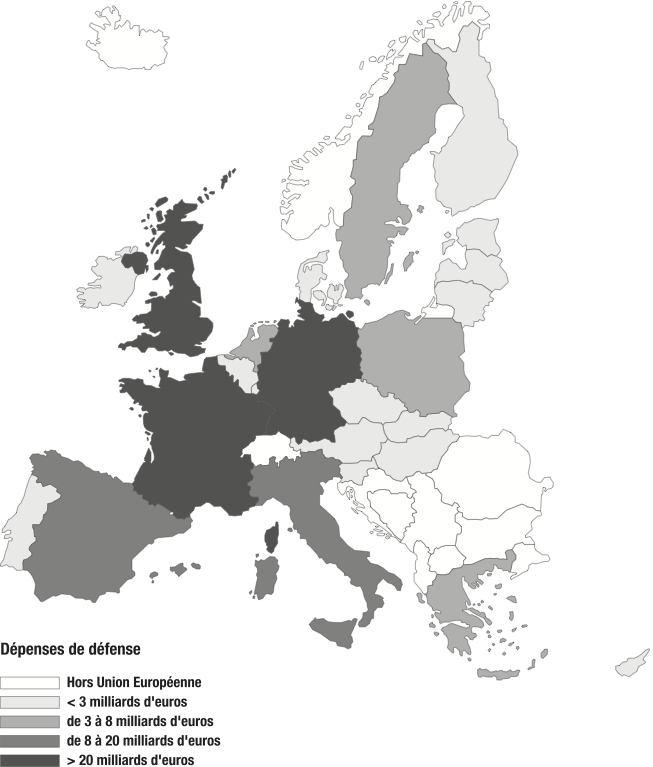
The breakdown of defence expenditure in the European Union highlights, on the one hand, a wide disparity and, on the other, the predominance of the LoI signatory states.(4) Effectively the five countries of the European Union with the highest defence expenditure are, in order, the United Kingdom (€36.8 bn), France (€29.1 bn), Germany (€22.9 bn), Italy (€12.2 bn) and Spain (€9.6 bn). Sweden, another of the LoI signatories, is not among the front-runners, but is none the less in eighth position, with defence expenditure of €4.8 bn, but behind the Netherlands and Poland.
The four major European countries (United Kingdom, France, Germany and Italy) account for 65% of the European Union’s total defence budget.
Overall, this map is not too different from the military manpower map, and this is confirmed by the high degree of correlation between the two rankings. (5)
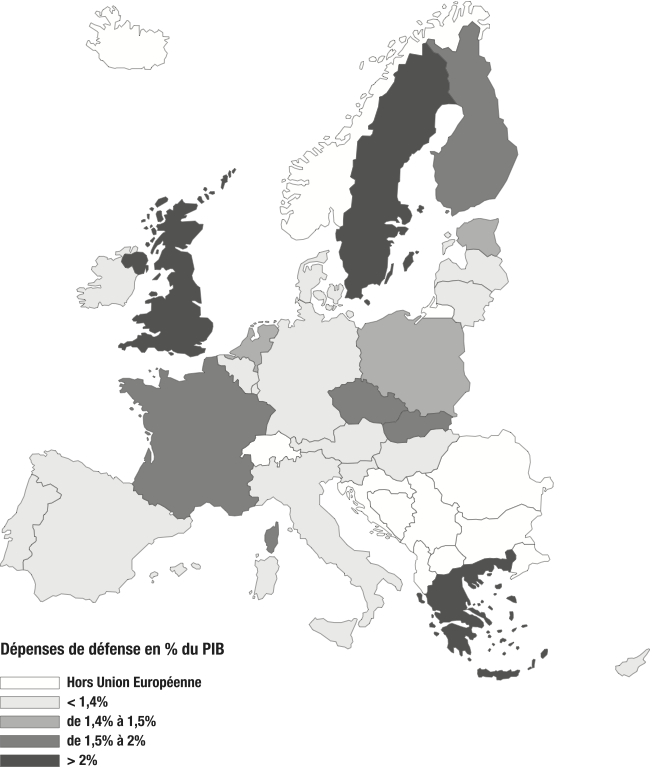
Defence Expenditure as a Percentage of GDP
As with the ratios of total defence expenditure, the comparison of European defence contributions as a percentage of GDP shows a very wide disparity: the range extends from 2.20% for the United Kingdom to 0.56% for Ireland; France is in fourth position with 1.76%, behind Sweden (2.07%) and Greece (2.02%). Note that Germany (1.11%) and Italy (0.84%) occupy the seventeenth and twentieth positions, modest ranking for these two major European countries, whilst Sweden (2.07%) and Greece (2.02%), behind the United Kingdom, form the podium group.
This map has nevertheless some distinguishing features compared with the map of total defence expenditure: when we examine the weight of defence expenditure as a share of national wealth, we find among the ten leading countries, four new members of the European Union (Slovakia, the Czech Republic, Estonia and Poland). These countries were well to the rear overall in the previous ranking. This observation must of course be seen in the light of the fact that, apart from Poland (whose GDP is roughly a quarter of France’s); these countries have a GDP (and correlative defence budgets) between ten and a hundred times smaller than France.
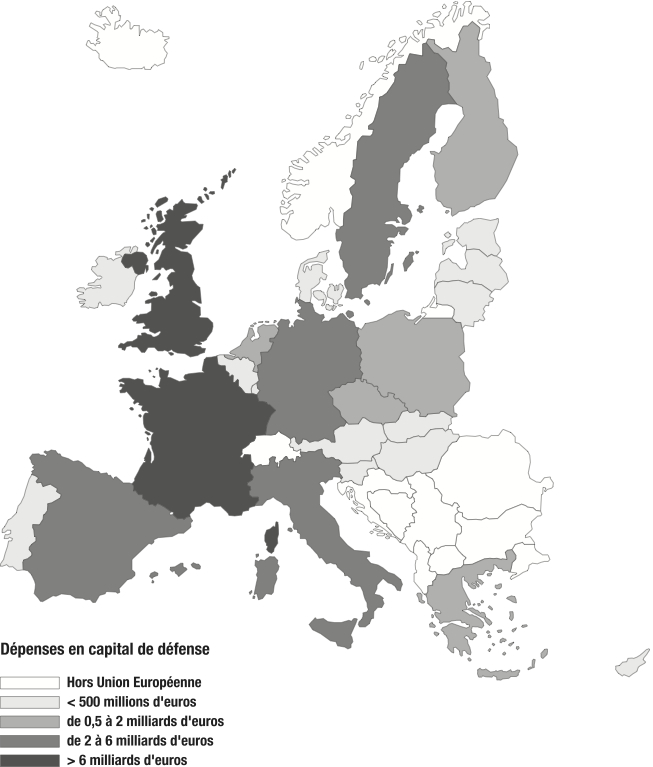
The map of defence capital expenditure is very similar to the map for total defence expenditure. This is hardly surprising, since the countries whose defence efforts are the greatest are also those with the highest defence capital expenditure. (6) It transpires that on this count, the best-placed countries are exactly the same six signatory states of the LoI, with France and the United Kingdom occupying respectively first and second positions, with €10.8 and 9.5 bn. (7)
Defence Capital Expenditure
Defence Capital Expenditure As A Percentage Of Total Defence Expenditure
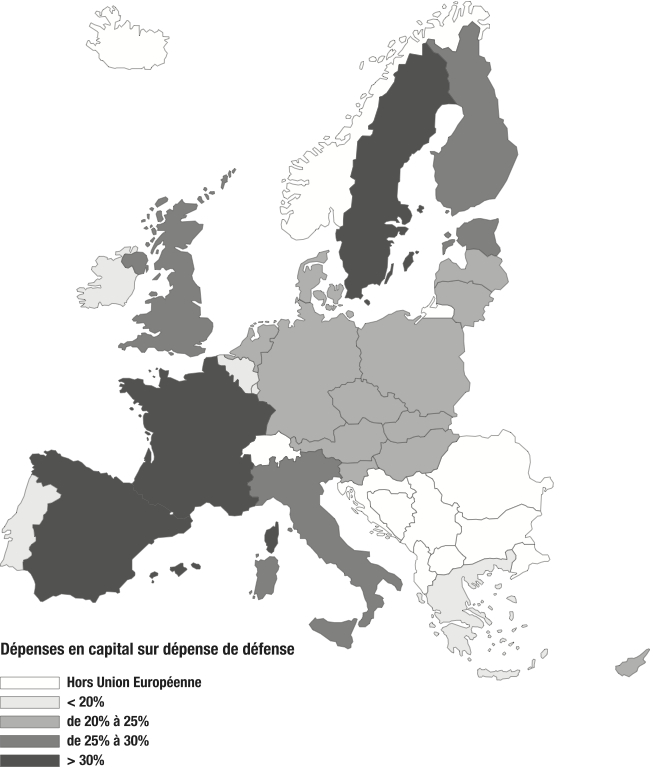
Expressed as a ratio of defence capital expenditure to the overall defence budget, France shows a figure of 37.2%, and is in second position in the Europe of 25, behind Sweden and ahead of Spain. However the bracket is very wide, varying from 52.8% for Sweden to 10.3% for Belgium, the United Kingdom being, at 25.8%, slightly above the average ratio of 22.8%.
Capital Expenditure As A Percentage Of Gdp
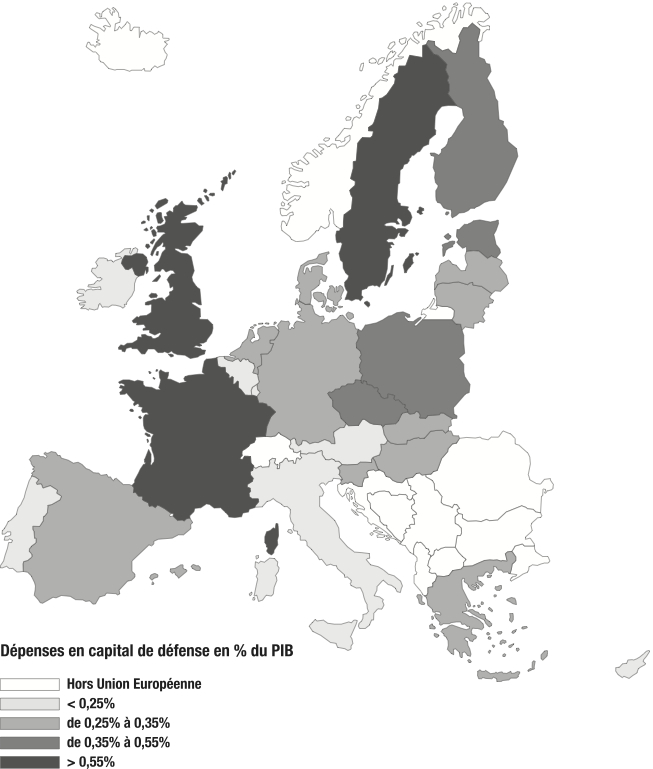
Defence capital expenditure shows a maximum of 1.09% of GDP in Sweden, followed by France with 0.66% and the United Kingdom with 0.56%. Germany and Italy are only in sixteenth and eighteenth positions, with 0.26% and 0.21% respectively.
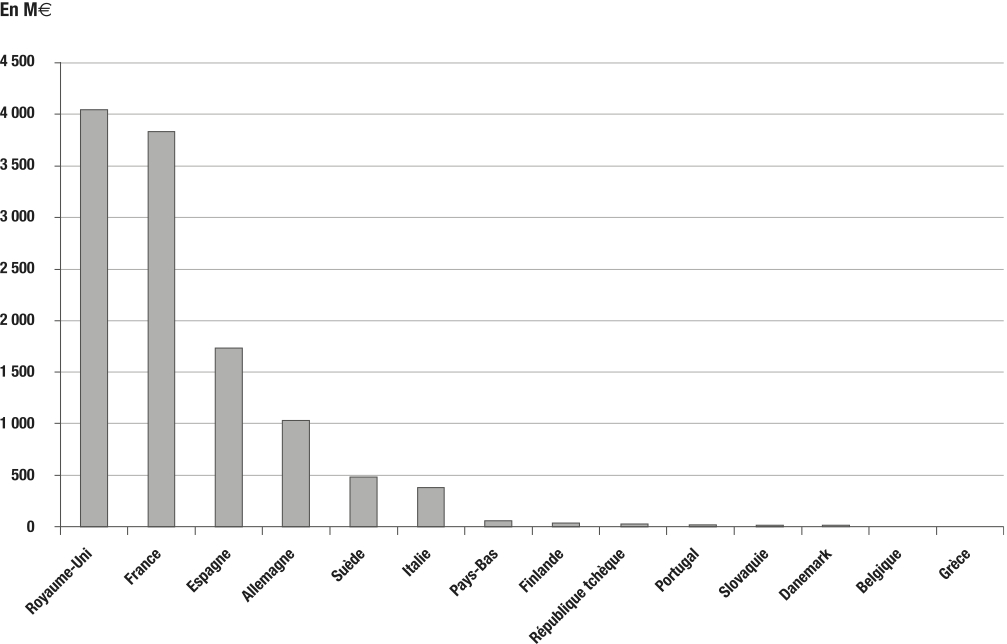
Defence Research And Development Expenditure
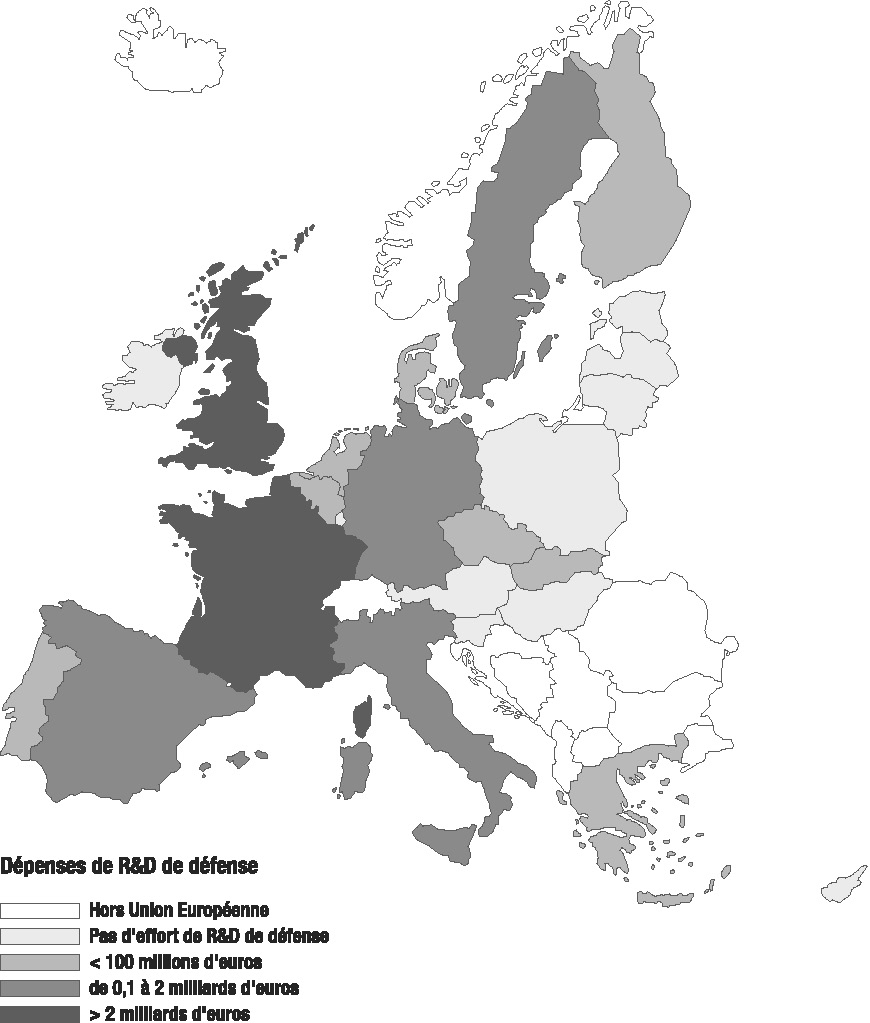
Defence Research and Development (R&D) expenditure in the European Union, measured here by public sector financing is, even more strikingly than in the case of total defence expenditure, a characteristic of the six LoI signatory states. In order, the United Kingdom, France, Spain, Germany, Sweden and Italy stand out significantly from all the others: these six alone account for more than 98% of total public investment in defence R&D in the European Union. The other countries are either far behind, in the case of eight of them, or simply have no significant defence R&D expenditure in the case of the eleven others.
Defence R&D in The European Union
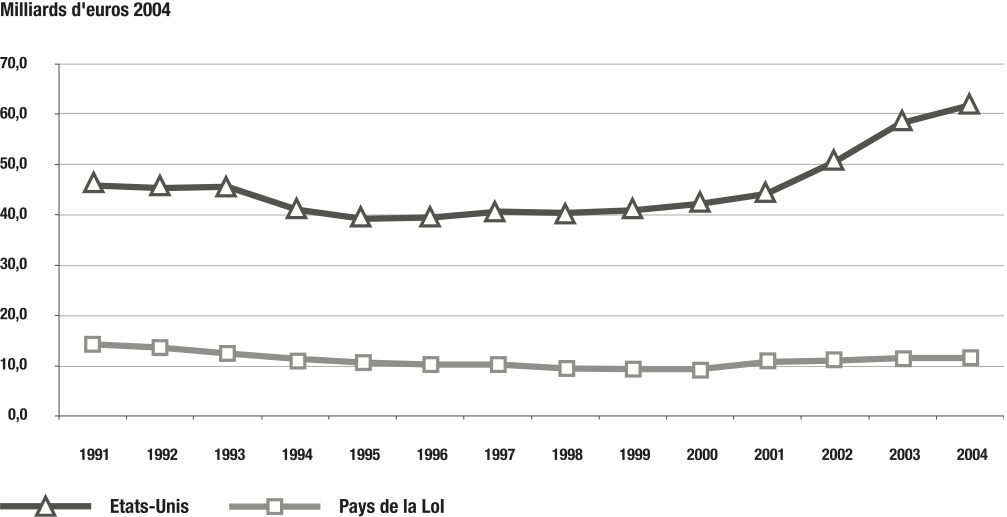
Concurrently, the lag behind the United States is growing: the European defence R&D budget has dropped from a quarter to a fifth of the US budget since the period 1996-2000. It was a total of €12 bn in 2004, against 62 for the Americans. Another striking figure, the European budget has progressed by €1 bn since 2001, and that of the United States by €20 bn.
Evolution of Defence R&D Expenditure of the United States and the LOl Countries (1991-2004)
Editor’s note: this article first appeared in Ecodef no. 39, novembre 2005.
(1) It should be noted that a new definition of defence expenditure came into effect in 2004, excluding expenditure related to the category ‘Other Forces’, except those elements capable of operational deployment. This is a substantial change from previous practice and entails a net reduction in expenditure for certain countries.
(2) Note that the inclusion of security forces with military status puts France and Italy in the lead with an additional 93,000 gendarmes and 91,000 carabinieri respectively.
(3) Inclusion of the totality of security forces would increase these levels to 1.3% for the two countries.
(4) LoI: Letter of Intent, signed on 6 July 1995 by six countries (France, United Kingdom, Germany, Italy, Spain and Sweden) concerning cooperation in armaments development.
(5) The correlation of rankings of the two variables is estimated at 0.95.
(6) The correlation of rankings of the two variables is estimated at 0.96.
(7) If we deduct nuclear costs from defence capital expenditure, the ranking remains virtually unchanged: only France and the United Kingdom would see their positions reversed. Effectively, the burden of nuclear weapon costs in the United Kingdom is relatively limited, unlike France, while the other European countries are not nuclear powers.